

Knowing the Storage Tier performance statistic will help System Admin to troubleshot the performance issue. In this post, I will show you how to collect storage tier performance statistic using Windows Perfmon.
You can get the individual SSD/HDD performance (basic latency and reliability) using the PowerShell below.
Get-VirtualDisk -FriendlyName VirtualDisk01 | Get-PhysicalDisk | Get-StorageReliabilityCounter | Select DeviceId,FlushLatencyMax,ReadLatencyMax,WriteLatencyMax,ReadErrorsCorrected,WriteErrorsCorrected,ReadErrorsTotal,WriteErrorsTotalHowever, how about the Storage Space Performance?
You can use the performance counters for the Tier object in Storage Spaces to get additional data that can help you evaluate the following aspects of storage tiers performance:
- Check for bottlenecks on a tier—Two performance counters—Tier Transfers/Sec and Tier Queue Length—can probably give you a good idea of whether a bottleneck has developed on a tier.
- Review Write latency—Ideally, the SSD tier and the HDD tier have similar Write latency because all Writes to the HDD tier are being absorbed by the write-back cache. A higher Write latency on the HDD tier can indicate a couple of things:
- The write-back cache is full and is throttling. Check Bytes Used for the Cache object.
- The Writes are large enough to bypass the write-back cache (Writes larger than 256 KB are not written to the cache). Compare Cache Writes/sec (Cache object) with Tier Writes/sec (Tier object).
- Review Read performance—Be aware that for Reads, especially in random I/O, the HDD tier is expected to perform more slowly than the SSD tier.
For Windows 2012R2, you need to install KB 2980661: Update to add a new performance counter feature for Tiered Storage Spaces in Windows Server 2012 R2.
Using Performance Monitor:
I’ve created a Data Collector Template that you can use to create on new Data Collector Sets. You can download it from here. To start performance monitor:
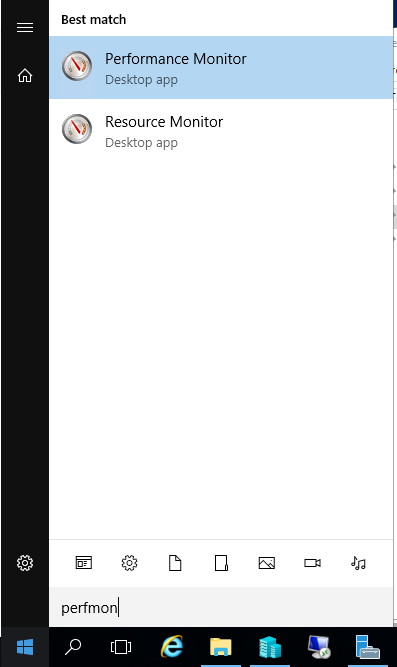
Click Start, click in the Start Search box, type perfmon , and press ENTER.
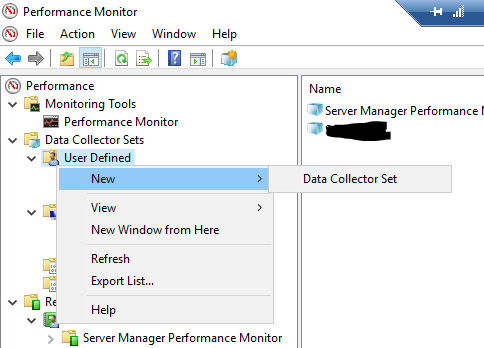
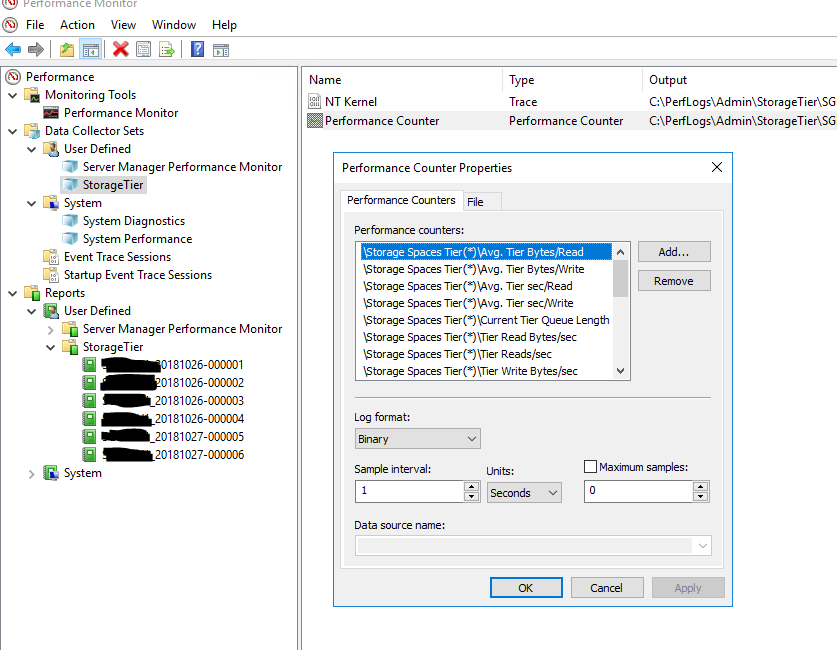
On the performance monitor window, right click on the performance monitor or Data Collector sets -> select “New” and “Data Collector Set”
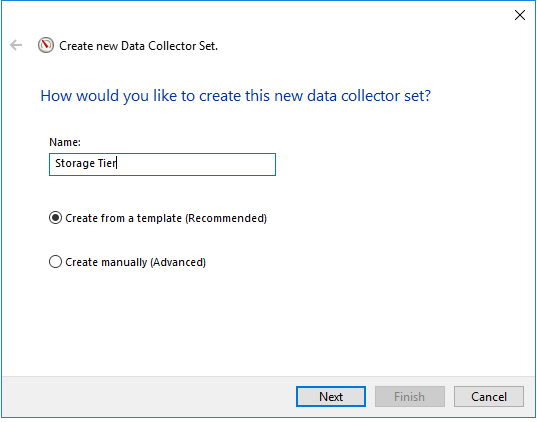
On Create New Data Collector Set, Enter the name of data collector set that you want to assign and select “Create from a template (recommended)
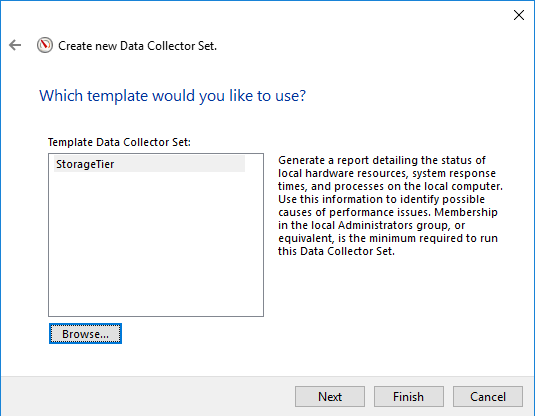
On the second window, click the Browse button and select the XML file that has been downloaded before. After that click finish.
You can modify the performance counter from before start the data collector set.
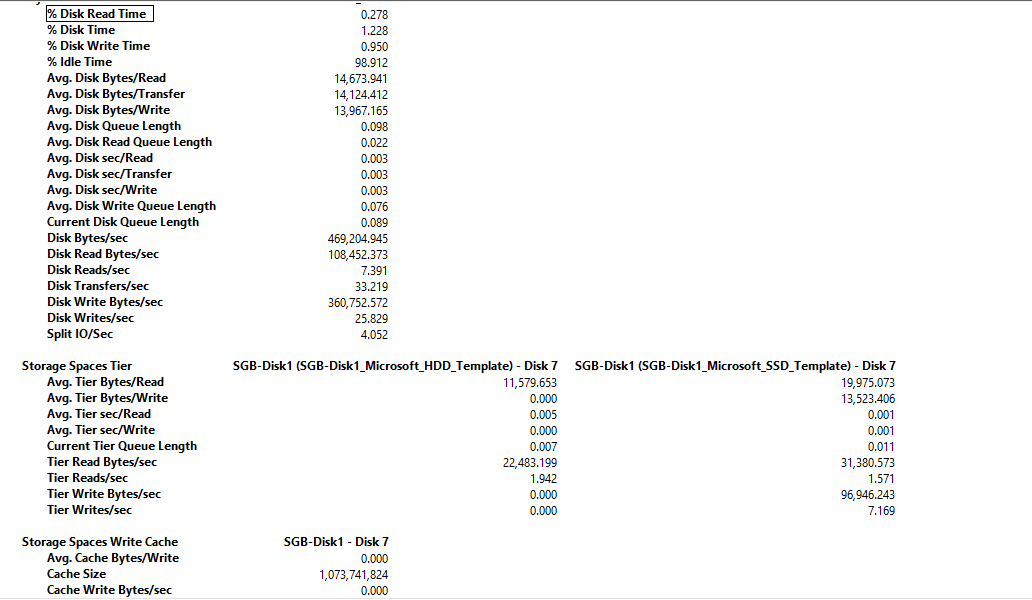
After you run the Data Collector, you can view the report on the “Report” section. Below is the example report from my Storage Space Tier.
Counter descriptions: Tier object (Storage Spaces)
| Counter Name | Description |
|---|---|
| Avg. Tier Bytes/Transfer | The average size of individual Read and Write requests (I/O size) to the storage tier for the capture interval. |
| Tier Transfer Bytes/sec | The transfer speed for Read and Write requests to the tier (in bytes per second). |
| Avg. Tier Queue Length | Measures latency over time—the average number of outstanding Read and Write requests to the tier, including requests currently in service and those waiting for service. |
| Avg. Tier sec/Transfer | The average time it takes to complete a Read or Write operation on the tier. |
| Tier Transfers/sec | The number of transfers completed in the previous second—known as IOPS, or Inputs/Outputs per second. If the capture interval in Performance Monitor is greater than 1 second, the average of the values captured is presented. |
| Current Tier Queue Length | The number of outstanding Read and Write requests to the tier, including requests currently in service and requests waiting for service. |
| Avg. Tier Bytes/Write | The average size, including metadata, of individual Write requests that went to the storage tier during the capture interval. |
| Tier Write Bytes/sec | The average speed of Writes to the tier (in bytes per second). |
| Avg. Tier Write Queue Length | The average number of outstanding Write requests to the tier, including requests currently in service and requests waiting for service. |
| Avg. Tier sec/Write | The average number of seconds required per Write on the tier. |
| Tier Writes/sec | Writes per second on the tier. If the capture interval in Performance Monitor is greater than 1 second, the average of the values captured is displayed. |
| Avg. Tier Bytes/Read | The average size of individual Read requests (I/O size) on the storage tier for the capture interval (in bytes). |
| Tier Read Bytes/se | The average speed of Reads to the tier (in Bytes per second). |
| Avg. Tier Read Queue Length | The average number of outstanding Read requests to the tier, including requests currently in service and requests waiting for service. |
| Avg. Tier sec/Read | Average seconds per Read on the tier. |
| Tier Reads/sec | Reads per second on the tier. If the capture interval in Performance Monitor is greater than 1 second, the average of the values captured is presented. |
External Reference:
– https://docs.microsoft.com/en-us/previous-versions/windows/it-pro/windows-server-2012-R2-and-2012/dn789160(v=ws.11)#use-performance-counters-to-monitor-storage-tiers
– https://support.microsoft.com/en-us/help/2980661/update-to-add-a-new-performance-counter-feature-for-tiered-storage-spa
– https://blogs.msdn.microsoft.com/clustering/2014/06/05/cluster-shared-volume-performance-counters/